Introduction
A staple of discussion amongst divers is the question of which decompression algorithm they use. From Haldanean to RGBM, to Bühlmann + Gradient Factors (GFs) and VPM-B (and any proprietary combination you care to throw in between), the options are considerable.
One of the pertinent questions on the topic is the issue of whether to adopt:
(1) A bubble modelling approach (e.g. VPM-B) that inserts deep stops into one’s dive profile (‘Deep Stops Profile’ hereafter), or
(2) A dissolved-gas model (e.g. a Bühlmann algorithm) that cuts down on deep stops in favour of longer shallower stops (‘Shallow Stops Profile’ hereafter).
In this article I assume that the reader has some basic familiarity with the two classes of model in question, so I will not dwell on that here. I will only say that from a theoretical standpoint, there are arguments that would favour either approach. So how could we decide between these two options? In science, such a decision can only be taken on the basis of empiricism, i.e. experiment. In other words, carry out a survey of an appropriate sample of dives on profiles dictated by both approaches, and pick the one that results in a smaller probability of decompression sickness (DCS) cases following the choice of an appropriate statistical test. This was the motivation of a 2008 study by the U.S. Navy Experimental Diving Unit (NEDU), authored by David Doolette, Wayne A. Gerth and Keith A. Gault and made public in 2011.
Much has been discussed already about this study, particularly on online fora, sometimes leading to very heated back-and-forths. Part of the discussion revolved around the question of equivalence (or, as the opponents argued, lack thereof) between the deep stop profiles adopted in the NEDU study and the actual deep stops profiles followed by divers in real-world situations; the arguments raised were answered there. This article has nothing to do with that matter.
In this post, I wish to focus on a different question altogether, namely the interpretation of aspects of the NEDU study, specifically the statistical significance of the probability of DCS (for the two approaches) presented by the study. I am referring in particular to Figure 2 of that report, which is being reproduced below, and which shows the DCS incidence for the two approaches:
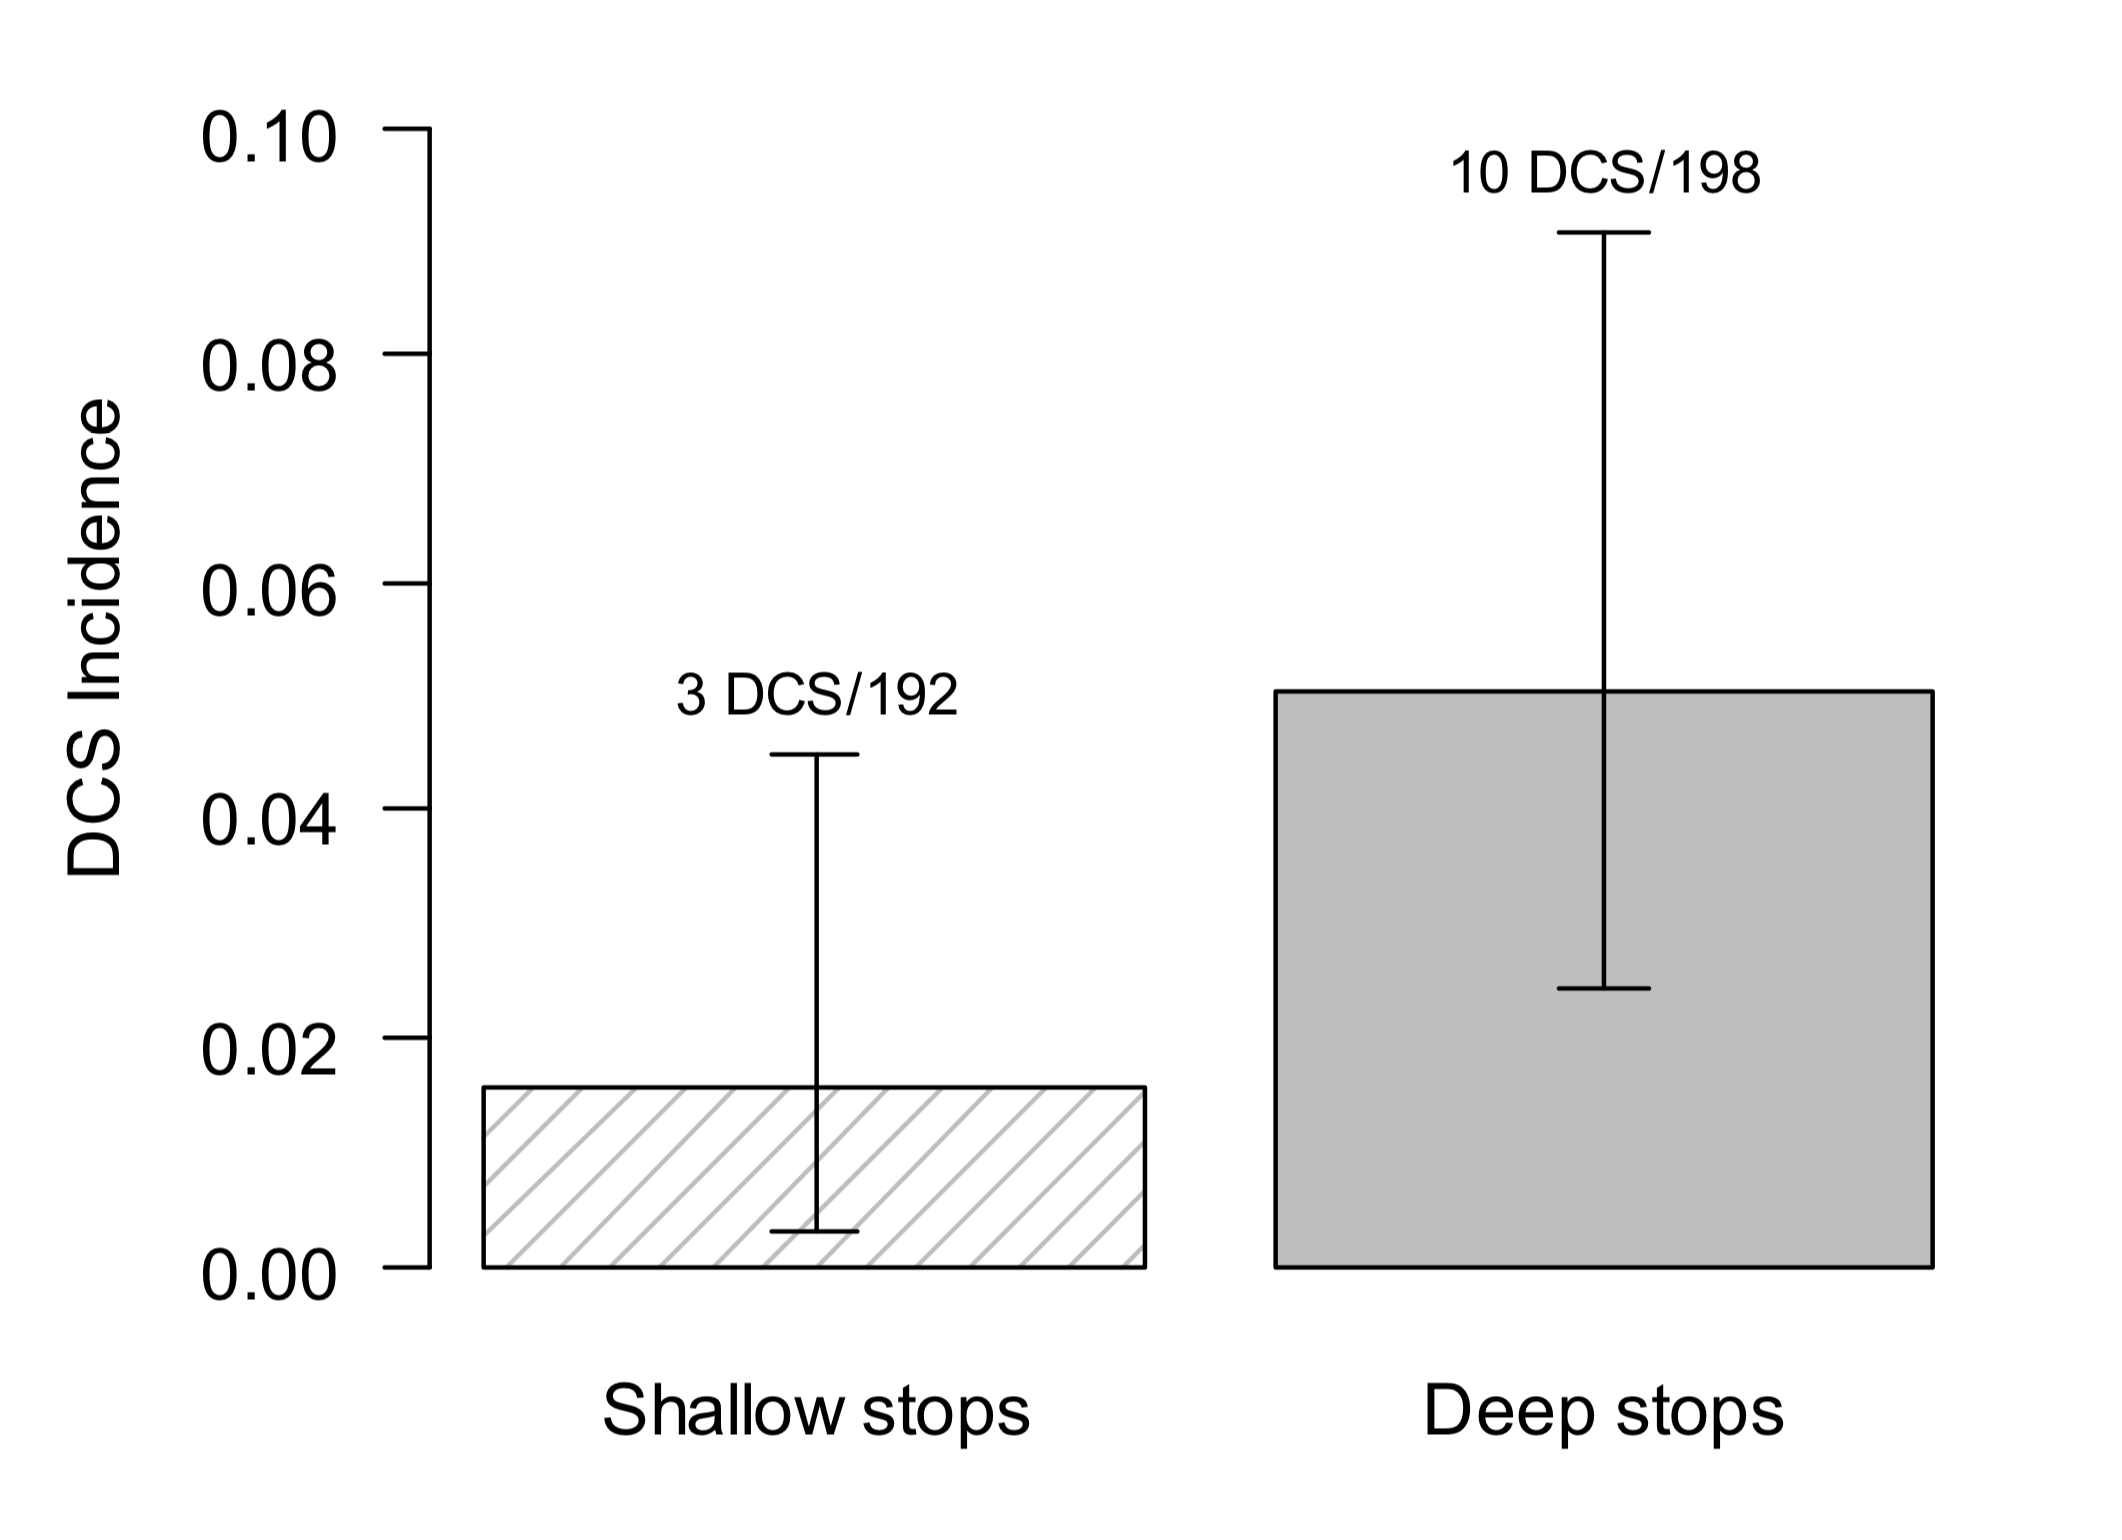
Subsequent sections of the NEDU report include an investigation of Venous Gas Emboli (VGE) grades and a theoretical discussion of the reported results on DCS and VGE outcomes, but the main thrust of this study is the incidence of DCS as presented in the above figure (which is also the most often referred to result by divers who are aware of this study), at least in my experience.
Let me clarify an important point at the outset: my aim with this article is neither to support nor dismiss this report. The NEDU investigation is a careful study and the authors’ effort should be commended. The reason for this article is that I have time and again encountered arguments amongst divers that misinterpret the findings, very often because they’ve either not read the study itself, or because of a misunderstanding of the subtleties of statistical analysis. What I intend to achieve with this post is to elucidate what that plot is actually telling us, and the statistical significance associated with it.
Without further ado, let us dive in.
Statistical Interpretation of DCS Incidence in the NEDU Study
The authors are interested in finding out whether deep stops profiles dictated by a bubble model are more efficient than shallow stops profiles dictated by a gas content model. The gas-content model in use was VVAL 18 Thalmann, whereas the bubble model was BVM(3).
What you should know first: a brief statistics primer
There are many different kinds of statistical analysis you can employ, and oftentimes the choice is dictated by the type of the experiment being carried out. The statistical analysis used in the NEDU study involves what is known as an exact test. More specifically, the test in use is known as Fisher’s exact test, named after its inventor, biologist and statistician Ronald Fisher.
What an exact test allows you to do in practice is the following: Suppose you want to find out whether there is a relationship between two given phenomena. You begin by assuming what is known as the null hypothesis. The null hypothesis declares: “There is no relationship between the two phenomena.” Next, you try to reject this null hypothesis (i.e. nullify it, hence the name). If you manage to reject/nullify it, in effect you can say that there is a relationship between the two phenomena in question; in other words, you’ve found support for your alternative hypothesis that there is a relationship.
An exact test gives you the ability to be specific about your claim. First, before anything else, you choose what we call a significance level. Let us say you choose a significance level of 5%. That means that the study will have a 5% probability that it rejects the null hypothesis even if it were true. So in other words, at a significance level of 5%, you can expect your study to mistakenly reject the null hypothesis 5% of the time in the long run.
Now, let us say you are ready to accept this 5% “risk” of mistakenly rejecting the null hypothesis. You next carry out your experiment. Following this, you run your test statistic (e.g. Fisher’s exact test) on your result, and you get out a number that represents the probability of obtaining your result IF the null hypothesis (which you want to reject) is actually true. This number is known as the p-value. As you can infer, you don’t want this to be a large number.
If the p-value you get is small, specifically smaller than the 5% significance level you’ve adopted, then there’s too small a probability that you would obtain your result if the null hypothesis were true.
Therefore, the null hypothesis must be false, and therefore you reject the null hypothesis. On the other hand, if the p-value is higher than your adopted significance level, you cannot reject the null hypothesis.
Many research papers, including this study, employ this 5% threshold. This is merely an accepted convention, not some deeply revered number. Mathematically, this threshold is denoted by the Greek symbol α (alpha), such that an alpha level (also known as significance level) of 5% is written as α=0.05 (because 5% = 5/100 = 0.05). If the result of your test statistic yields an outcome (p-value) smaller than 0.05, then your result is statistically significant. Say you get a p-value of 0.02. 0.02 is less than 0.05, so you’re good.
Now, one last word. If you’re not happy with a 5% threshold, i.e. if you feel that the chance of mistakenly rejecting the null hypothesis 5% of the time is too high for your comfort, then you can choose to adopt a smaller number (e.g. 1% or 0.01) for your study. That means that your p-value has to be less than 0.01 in order for your result to be statistically significant. The choice of threshold boils down to the following question: what level of risk of wrongly rejecting the null hypothesis am I happy with? 5%? 3% 1%?” Many papers use 5%. Some choose a more stringent threshold.
In physics, and in particular particle physics, the convention is that we use a p-value less than 0.003 (what we call a 3-sigma event) to say that a given result constitutes evidence for a phenomenon (e.g. evidence for a new particle), and a p-value less than 0.0000003 (a 5-sigma event) to call the result a discovery. This is much more stringent than most scientific papers.

How does a Fisher’s exact test work?
Let us say we want to test two decompression approaches; just for convenience we’ll stick to the same numbers of the NEDU study. We do not yet know which might be the better decompression approach. Let us say we run our experiment, testing divers on both approaches, and find 3 DCS cases out of 192 dives for shallow stops, and 10 DCS cases out of 198 dives for deep stops. We illustrate these results in what is known as a contingency table:
| Shallow Stops | Deep Stops | Total | |
| DCS | 3 | 10 | 13 |
| No DCS | 189 | 188 | 377 |
| Total | 192 | 198 |
Probability we get these numbers = 0.0371
Notice the probability quoted just below the table? What is that? Well, suppose you ask yourself the question: What are the chances you get these numbers in the table? This is what probability means. But you might be wondering: how do we obtain the probability for the distribution of these values? That’s where Fisher’s Exact test (which is our test statistic) comes in.
Let’s write that table again, but instead of numbers we’re going to use letters to represent the entries in the cell. We have:
| Shallow Stops | Deep Stops | Total | |
| DCS | a | b | a+b |
| No DCS | c | d | c+d |
| Total | a+c | b+d | n=a+b+c+d |
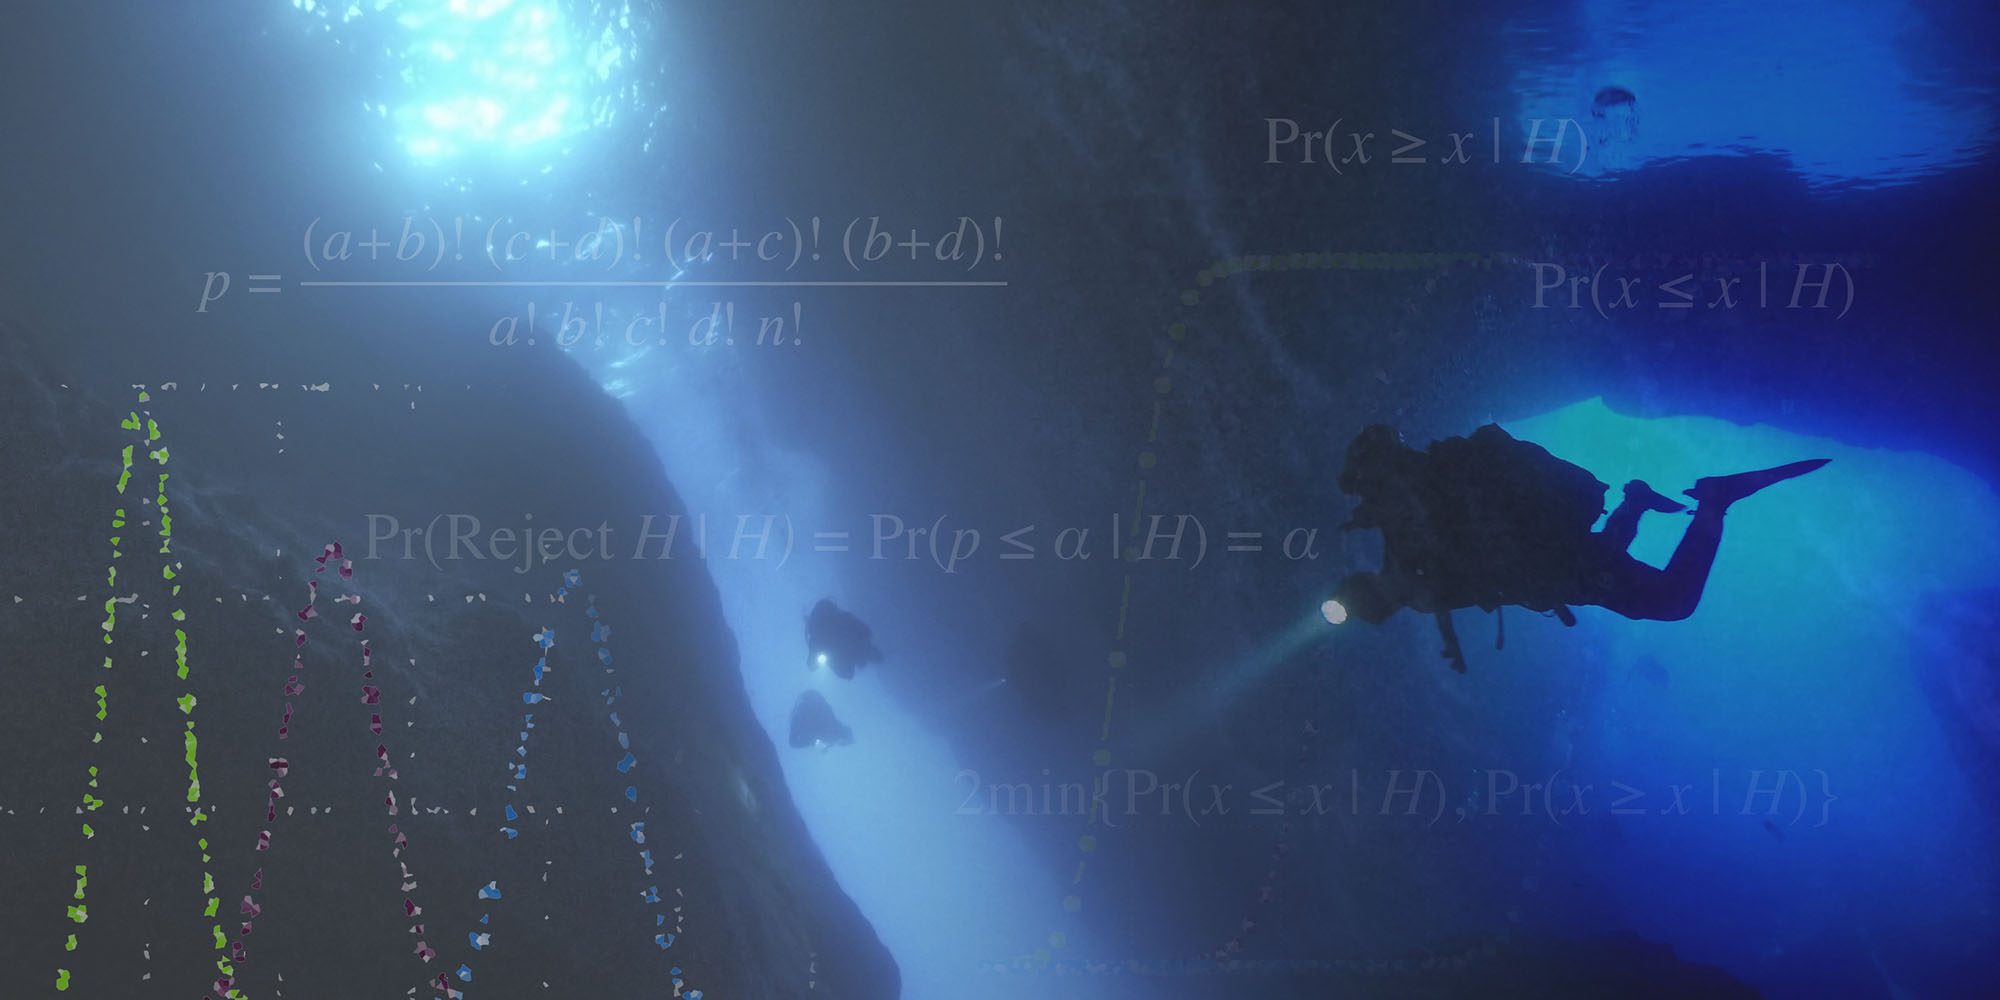
The probability that we get this distribution of numbers is given by the Fisher exact test as:
You see those exclamation marks (“!”)? In mathematics we call that “!” symbol “factorial”. As an example, 5! means: 5 X 4 X 3 X 2 X 1, i.e. we multiply 5 by all numbers smaller than it down to the number 1. 3! means 3 X 2 X 1 and so on.
In the case of our table, the letters simply take on the values: a=3, b=10, c=192, d=198, n=3+10+192+198=403. So we have:
Fisher’s exact test continues by next listing more extreme potential outcomes. For example, instead of having 3 DCS cases for shallow stops and 10 DCS cases for deep stops, we could have 2 for shallow and 11 for deep, or 1 for shallow and 12 for deep, or even (the most extreme) 0 for shallow and 13 for deep. These are all possible (more extreme) distributions. These cases are shown in the tables below together with the probability for each, computed as above. You’ll have noticed that I haven’t really said where the probability formula comes from. If you are interested, have a look at the footnote at the bottom of this box.
| Shallow Stops | Deep Stops | Total | |
| DCS | 2 | 11 | 13 |
| No DCS | 188 | 187 | 377 |
| Total | 192 | 198 |
Probability we get these numbers = 0.0100
| Shallow Stops | Deep Stops | Total | |
| DCS | 1 | 12 | 13 |
| No DCS | 189 | 186 | 377 |
| Total | 192 | 198 |
Probability we get these numbers = 0.0016
| Shallow Stops | Deep Stops | Total | |
| DCS | 0 | 13 | 13 |
| No DCS | 190 | 185 | 377 |
| Total | 192 | 198 |
Probability we get these numbers = 0.0001
Notice how the more extreme the distribution, the smaller the probability becomes.
Adding them all up we get: 0.0488. This is our p-value. So the result that we find 3 DCS cases out of 193 for shallow stops and 10 DCS cases out of 198 for deep stops has a p-value of 0.0488. If our adopted threshold is 0.05, then since 0.0488 is a smaller number, the result would be statistically significant.
However, so far we have only carried out our test in one direction. When we listed the more extreme possibilities, we did not consider the other direction in which this could go. Namely, we could have more DCS cases for the shallow stops and fewer DCS cases for the deep stops. In other words, we could have situations like: 4 for shallow and 9 for deep, or 5 for shallow and 8 for deep, all the way to the most extreme case of 13 for shallow and 0 for deep.
This is a crucial point. If we have no idea which approach might be better, then we should carry out a two-sided (aka two-tailed) test. In the above, we have only considered one direction, so that test is one-sided. To carry out a two-sided test, we have to consider extreme possibilities in the other direction, obtain their probabilities (like we did above) and add these on to get our final p-value. If we do so, we find a p-value of 0.0874. As you can appreciate, that’s a larger number than 0.0488, considerably exceeding the adopted threshold of α=0.05, which means that a two-sided test does not yield a statistically significant result.
In order to properly understand where that probability formula comes from, we would need to go into quite some detailed theory. However, as an aid to your understanding, let me just say that in probability theory, that factorial symbol comes up a lot when we are thinking about possible distributions or possible ways of arrangements (such as what we are doing with the tables above , i.e. arranging the distribution of numbers in different ways). For example, imagine I gave you three cards – one blue, one green, and one red – and I told you to arrange them in sequence in any order you want. How many different possibilities do you have? When choosing your first card, you still have three options to choose from (blue, green, or red), so you have a choice of three [3]. Once you’ve chosen the first card, you have two options [2] left for the second card. Finally, for the last card, you have just one card left, so only one [1] option. So in total you have 3×2×1 ways of arranging the three cards, which is 3! (three factorial.)
Right, we are ready to move on to the NEDU study and apply our newfound knowledge of statistical testing.
Applying this knowledge to the NEDU study
Putting the NEDU study within the statistical framework we detailed above, this is what it’s saying:
NULL HYPOTHESIS (which we want to reject):
A deep stops profile is AS efficient as, or LESS efficient than, a shallow stops profile. The probability of good outcomes for the deep stops profile is the same as, or smaller than, for the shallow stops profile. Equivalently, the probability of DCS for the deep stops profile is the same as, or larger than, for the shallow stops profile. We want to reject this hypothesis.
ALTERNATIVE HYPOTHESIS:
A deep stops profile is MORE efficient than a shallow stops profile, i.e. we expect a larger probability of good outcomes for a deep stops profile than for a shallow stops profile (in other words, a smaller probability of DCS cases for a deep stops profile). This is our direction of testing.
In such a case, we will be using the same statistical test chosen by the authors, a one-sided Fisher’s exact test, with the alternative hypothesis being “greater” (i.e. we expect a larger probability of cases with a good outcome). If we do NOT find a statistically significant result according to this test, we do not have strong support (alternatively, our evidence is weak) that a deep stops profile is better. And we would say: “OK, we’ve tried to find evidence that a deep stops profile is better, but despite testing in that direction, we failed”. That is, we cannot reject the null hypothesis that “a deep stops profile is AS efficient as, or LESS efficient than, a shallow stops profile”. (For all we know, a deep stops profile might still be more efficient than a shallow stops profile, but we haven’t found sufficient evidence for that.) We might go, “well, right, might as well just stick to what we have been using so far, i.e. a shallow stops profile”.
If, on the other hand, while testing in this direction (that a deep stops profile is more efficient than a shallow stops profile) we indeed find support that a deep stops profile might be more efficient than a shallow stops profile, we say we have a statistically significant result. Now, we might be tempted to shout “hey, clearly a deep stops profile is better”. However, really, we should be careful. We have tested only in one direction. We decided a priori that our null hypothesis was going to be that “a deep stops profile is AS efficient as, or LESS efficient than, a shallow stops profile”, and are interested only in the result that a deep stops profile is more efficient than a shallow stops profile.
However, we really ought to entertain the possibility that a shallow stops profile might be better than a deep stops profile, given that our departure point should be that we do not know. Accounting for this possibility by adopting a two-sided (or two-tailed) test, reduces the statistical significance of a positive result in the first direction we were testing. The takeaway here is the following:
(1) Testing in the same direction as the result you expect and obtaining a p-value larger than your significance level (a “negative” result) constitutes a lack of statistical significance; you are “free” to stick to the “old” approach you have been using until now (pending a larger study perhaps). You cannot reject the null hypothesis because you don’t have a statistically significant result.
(2) Testing in the same direction as the result you expect and obtaining a p-value less than your significance level (a “positive” result) constitutes statistical significance, but does not provide enough justification to deem the supported approach conclusively better than the other UNLESS you also test in the opposite direction.
In summary, ideally we should carry out what is known as a two-sided test, testing in both directions of possibility.
As it turns out, and for a good reason which will be described in the next section, the authors of the study did not proceed with the hypothesis framework described in the “NEDU Original Framework” box above.
Midway Point Analysis
Given that the end-result of this study was DCS, the authors rightly tried to minimise unnecessary injury to test subjects. Therefore, they decided in advance that once they would reach the midway point (i.e. once they would reach 188 test dives out of the envisaged total of 375), they would “pause” and analyse the results, and if a significantly greater incidence of DCS was found for the deep stops profile than for the shallow stops profile, the trial would be put to a stop right there and then.
Putting their midpoint analysis in a statistical framework:
NULL HYPOTHESIS (which we want to reject):
A deep stops profile is as efficient as, or more efficient than, a shallow stops profile. The probability of good outcomes for the deep stops profile is the same as, or larger than, for the shallow stops profile. Equivalently, the probability of DCS for the deep stops profile is the same as, or lower than, for the shallow stops profile. We want to reject this hypothesis.
ALTERNATIVE HYPOTHESIS:
A deep stops profile is less efficient than a shallow stops profile, i.e. we expect a smaller probability of good outcomes for a deep stops profile than for a shallow stops profile (in other words, a larger probability of DCS for a deep stops profile). This is our direction of testing.
In this case, we shall again be using the one-sided Fisher’s exact test (chosen by the authors), with the alternative hypothesis being “less” (i.e. fewer cases of good outcome). If we test in this direction and indeed find that there are fewer good outcomes, then we might say, “hey, we tested in this direction (fewer cases of good outcomes) and we find support for that. We don’t want to take further risk and possibly injure our subjects. So we’ll stop our experiment here”.
However, as we saw above (in the orange box), finding support in the direction you are testing is NOT sufficient to conclude that this is necessarily the better approach.
Basically, we have excluded testing in the other direction (alternative hypothesis being “greater”). We have not tested the possibility that a deep stops profile might be better (i.e. gives a larger probability of good outcomes) than a shallow stops profile. Not testing in this other direction as well means that we cannot decisively choose which is the best out of the two options of dive profile.
Let me be clear: from an ethical point of view, in terms of protecting the test subjects of the study, the approach of stopping the trial if you found one-sided statistical significance that the new approach (a deep stops profile) yields a smaller probability of good outcomes is justifiable. Given the context within which the study was carried out, namely the fact that the U.S. Navy would depart from continuing to use shallow-stop profiles ONLY in case of the “finding of significantly lower PDCS [probability of DCS] for the bubble model schedule [deep-stops profiles] than the gas content model schedule [shallow-stops profile]” the choice of a one-sided test is appropriate, as the authors point out. However, one has to keep this context and associated implications in mind when interpreting this study.
A two-sided test
What the above approach does NOT inform us about, is which of the two approaches (deep stops or shallow stops) is “the best”. In order to come to solid conclusions, we need to carry out a two-sided test that entertains both possibilities, because we simply do not know a priori which is the best of the two. When trying to decide between two possible approaches, with the point of departure being that we do not yet know if there is any difference between the two and are equally interested in either outcome, then we carry out a two-tailed test.
Let us say we are trying to establish whether there is any difference between two approaches, let’s call them A and B. Is the incidence of successes (good outcomes) equal for both? We would like to show that it is not. Our null hypothesis is that there is no difference between the two approaches, and that both yield the same result. (A “neutral” null hypothesis.)
So next we carry out the experiment. Let us say, for the purpose of this example, that we find A seems to be giving us a greater number of successes than B. We then run our two-sided test statistic, say a two-tailed Fisher exact test, and get a low p-value, smaller than our adopted significance level. In such a case, we can say that there is a difference between the outcomes of A and B at a statistically significant level. (If our p-value is found to be higher than the significance level, all we can say is that we do not have a statistically significant result. Full stop.)
In other words, within a statistical framework, we would like to pose our question about the two decompression approaches as:
NULL HYPOTHESIS (which we want to reject):
A deep stops profile is as efficient as a shallow stops profile, and the probability of good outcomes (or, equivalently, DCS) is the same for both. We want to reject this hypothesis.
ALTERNATIVE HYPOTHESIS:
Either a deep stops profile is more efficient than a shallow stops profile, i.e. a shallow stops profile is less efficient [this is one direction] OR a deep stops profile is less efficient than a shallow stops profile, i.e. a shallow stops profile is more efficient [this is the opposite direction].
However, as we’ve mentioned before, the authors carried out a one-sided Fisher’s exact test (with α=0.05) at the midpoint analysis. What they are interested in here is the question of whether the deep stops profile is less efficient than a shallow stops profile (that’s the alternative hypothesis), lest they continue with the experiment and end up hurting the test subjects. They want to reject (the null hypothesis) that the deep stops profile is equally efficient to, or more efficient than, a shallow stops profile. Indeed, when the problem is framed this way, there is statistically significant support for their alternative hypothesis (smaller probability of DCS-free outcomes in a deep stops profile than in a shallow stops profile), and that justified the ending of their trial on ethical grounds. However, as we have seen, this result does not conclusively tell us which approach (deep stops profile or shallow stops profile) is more efficient. It merely tells us that up to the number of cases they tested, they found a result that supports their expected result when testing in the same direction as the result they are interested in. Mathematically, they find a p-value of 0.047. That means that the probability of finding the results they do IF the null hypothesis were actually true is only 4.89%, which is less than the significance level of 5%. So that would suggest to us that a deep stops profile is less efficient than a shallow stops profile.
To make this as clear as possible, let me remind you what we said earlier on: just like many research papers, this report adopts the conventional significance level of 0.05 (i.e. it has a 5% chance of mistakenly rejecting the null hypothesis); that means that the test result is deemed as statistically significant if the associated p-value is less than 0.05. If it’s more than 0.05, it is deemed NOT to constitute a statistically significant finding. One could argue that 0.0489 is fairly close to 0.05, but strictly speaking, it passes this test because it’s below the adopted threshold. (The nature of p-values is such that the reader should then decide for themselves whether they find the adopted cutoff and the test result acceptable or not.)
In all this, it is important to keep in mind the context of the original question, and remember that a one-sided test is being used.
If we were to frame our question as in the two-sided framework box above, adopting a two-sided test (i.e. testing in both directions of possibility), we would find a p-value of 0.087, i.e. there is an 8.7% probability you would find a difference between the two algorithms even if the null hypothesis is true, i.e. even if the deep stops profile is, after all, as efficient as a shallow stops profile. 8.7% falls outside our acceptable 5% threshold. This means that the result of a two-sided test applied to the hypothesis as stated in the two-sided framework box is not statistically significant.
(In the above, I have run the math and coded it up myself, but in the interest of space I have only presented the results.)
Some Further Analysis
Purely for purposes of illustration, let us take this analysis a bit further. Given the numbers of this study:
(1) Had there been one more DCS case amongst the deep-stop profiles, i.e. a result of 11/198 DCS cases (instead of 10/198), a two-sided Fisher exact test would have yielded a p-value of 0.054, i.e. still NOT a statistically significant result (adopting the p=0.05 cutoff).
(2) Had there been one less DCS case amongst the shallow-stop profiles, i.e. a result of 2/192 DCS cases (instead of 3/192), a two-sided Fisher exact test would have yielded a p-value of 0.036, i.e. a statistically significant result.
In case (2), we would have some certainty that there is a significant difference between the two approaches, because testing in both directions yields only a 3.6% chance of obtaining such a result even if the null hypothesis (that there was no difference) were true.
However, there’s a lesson to be learnt here. As you can see, a tiny change in numbers (essentially just one datapoint) can shift the significance of the result. This is why the ideal way forward would be to collect more data, i.e. test more subjects. The problem is that more data comes at the risk of harming more test divers. And that’s where ethical considerations come into play. This, I hope, helps you appreciate that indeed, the authors had to face quite a difficult decision. The options are:
(1) Carry out a larger study (i.e. collect more data) and carry out a two-sided test, potentially getting a statistically significant result that would help us learn more about difference in efficiency between the two profiles, or
(2) Place more importance on the safety of our subjects, and as soon as we suspect that there might be a risk of injury if we were to continue with our test, we stop.
Given that, as the authors themselves state in the introduction, “whether one approach is more efficient than the other is unknown”, a two-sided statistical test is desirable. Indeed, here I point the reader to Ruxton & Neuhäuser (2010, with whom I wholeheartedly agree) who point out that “we very rarely find ourselves in a position where we are comfortable with using a one-tailed test”. The nature of the NEDU study, however, entailed a real possibility of further injury to test subjects, and so the study foregoes two-sided statistical significance in favour of protecting the divers under study, utilising a one-sided test that delivers a statistically significant result with less data than a more demanding two-sided test would.
As a complete aside which you can skip (hence the fainter font colour), moving away from this study to speak more generally, it seems that a problem in biology literature is that authors often opt to use a one-sided test inappropriately. Lombardi & Hurlbert (2009) carried out a survey of every study published in 2005 in the two journals “Oecologia” and “Animal Behaviour” and found that 17% of the quoted p-values were derived from a one-sided test, whilst in 22% of cases the reader would not be able to tell whether a one- or two-sided test had been carried out. Ruxton & Neuhäuser (2010) also report that from their survey of a total of 359 papers in the journal “Ecology”, 17 (i.e. 5%) employed a one-sided test, and with the exception of one study, Ruxton & Neuhäuser (2010) find that this choice of one-sided testing was not appropriate.
Confidence Intervals
There is one final aspect about Fig. 2 of the NEDU study that we haven’t yet mentioned. You might notice that each bar has a vertical line running through it. This is what is known as a confidence interval. Specifically, the authors tell us in the caption that they are using a “Binomial 95% CI” (CI=Confidence Interval). What does this mean?
Let’s say you wanted to present the result of some study you’ve carried out. You could show the mean of your data, for example. That’s a result encapsulated in a single point estimate. However, your readers would also be interested in having an estimate about other plausible values that the parameter in question might take in the population you’re sampling. That’s where the confidence interval comes in.
The confidence interval is giving us a range of plausible values that is likely to encompass the value of the population parameter we are interested in (the DCS incidence in the case of the NEDU study). This will become clearer by means of an example. But before we do that, let me just formally define the level, C, of the confidence interval. The level C of the confidence interval tells us the probability that the interval we produced contains the true value of the parameter of interest. Here’s an example. Suppose the level C of the confidence interval is 95%. That means that the probability that the interval (drawn on the figure) contains the true value of DCS incidence is 95%. As you can appreciate, the smaller the interval is, the better, because the narrower the range of plausible values would be.
Blindness in Experiment
In scientific experiments it is of paramount importance that if a human decision is involved, the person taking that decision and logging the data is blind as to which trial the data came from to eliminate unconscious bias. The authors properly admit that for reasons of practicality, this study was not blind*: “This large man-trial had unique potential for response or diagnosis bias because it was not practical to conceal the diverging DCS incidence on the two schedules, not possible to blind diver-subjects to the schedules, and some DCS presented as subjective symptoms only.“
Appendix D opens by saying that “the tables below give the case narratives written by the attending Diving medical Officer”. Reading through the narratives, one encounters phrases such as the below three examples (bold font is my own):
- “34 year old active duty Navy diver presenting with right shoulder pain beginning 2 hours after surfacing from <gap> dive under profile A1.“
- “37 year old, active duty, male diver with 14 year history of Navy diving and no previous history of DCS injury completed a 170/30 experimental dive (profile A2)…”
- “A 37 year old active duty male diver completed experimental 170/30 “deep stops” decompression dive…”
- “The test diver surfaced from a 170/30 (A-2 profile) research profile at 1223 hrs.”
As is clear from the above, the DMO knew which dive profile was being followed on a given dive. And despite the best and purest of intentions, it is possible that if a DMO feels that they are assessing an “experimental” dive profile, then they would be more wary than usual, a situation that can lead to subconscious bias. If, on the other hand, the DMO had more faith in the “experimental” profile, this could lead to bias in the opposite direction. So we have a situation where neither the test subject nor the assessor (DMO) is blind to the category in which the dive falls (shallow stops or deep stops). Of course, for added safety reasons, whoever gets to treat the diver should know the case history, so the need for a DMO who is fully aware of the dive history is perfectly understandable. However, this does nothing to prevent potential bias from creeping in the study.
A possible way to mitigate this could be to have 2 DMOs: DMO 1 is blind about the study and case history, and simply writes down their assessment which is in turn used for the study. DMO 2 is fully aware of the case history and is given authority in the sense that, for extra safety, if DMO 2 feels the diver should undergo recompression treatment, it is this decision that is followed (while DMO 1 is kept blind). This is still not a perfect solution, but it helps to mitigate subconscious bias; DMO 1 is deciding basing ONLY upon the symptoms presented, and not any concern they might have about the fact that the dive was “experimental”.
Bias can go both ways, and trying to predict all possible factors of bias is mostly a hypothetical exercise and not a secure way of preventing it. The only way to be sure it’s eliminated is by designing (ideally double) blindness into an experiment.
*The authors comment, however, that the deep stops also generated higher VGE grades than shallow stops, and these are not subject to bias (e.g. a diver cannot increase their VGE grade just by thinking they might be bent).
A philosophical note (almost)
I wanted to mention one last thing about the kind of statistical analysis we’ve discussed in this article. The methodology we’ve talked about can be referred to as “classical hypothesis testing”. As we have seen, it is an approach that strives to reject a hypothesis (the null hypothesis) in the process giving us confidence in the alternative hypothesis. It does NOT, however, prove the alternative hypothesis. It is somewhat in our nature to be inclined to think that rejecting the null hypothesis automatically means proving the alternative hypothesis. However, our alternative hypothesis is just that: an alternative. It is not necessarily the only one; there could very well be others.
Conclusion
So where do we go from here? What is the whole point of this lengthy analysis and discussion of Figure 2 of the NEDU study? What should one take from all this?
First off, on the basis of these numbers, specifically, the aspect of this study dealing with incidence of clinical DCS, we should be careful about claiming that we know for sure which is the best decompression modelling approach. The data does not really provide a definitive conclusion about this. I would not be comfortable to claim otherwise; I would very much like to see a statistically significant result from a two-sided test. Moreover, the study has some shortcomings, such as the issue of blindness which, admittedly, can be hard to implement in a study of this kind. The study also had strengths; the subjects being Navy divers means that there’s a degree of commonality in their fitness that helps to make the sample somewhat more uniform.
There might very well be other studies in progress right now the results of which might eventually help us gain a better idea, but until such studies are completed and published, we cannot tell for sure. They might end up confirming the suggestions of this study, or not.
If I were to summarise the points going for and against this experiment, this would be it:
FOR:
(1) The sample is probably fairly uniform, in that it consists of experienced Navy divers with a degree of commonality in their fitness. (This reduces dependence on variables such as poor cardiovascular health, being overweight, etc.)
(2) A one-sided test yields a statistically significant result.
(3) VGE counts seem to agree (although VGE counts are not tantamount to DCS; the endpoint is clinical DCS).
AGAINST:
(1) If we apply a two-sided test, we do not get a statistically significant result. The study did not use a two-sided test (which test makes it harder to achieve statistical significance). Carrying out a two-sided test effectively means that we wouldn’t be focusing on just one direction. Our starting point is that we do not know if there is a difference between the two decompression approaches, and if there is, in which direction. If we take this approach, the experiment does not yield a statistically significant result. More data would be desirable, as can also be appreciated from the fairly wide confidence intervals.
(2) The study is not a blind experiment. Neither the subject nor the assessor (of whether a diver has suffered DCS or not) was blind as to which dive profile was followed.
(3) The combination of (1) and (2), i.e. the combination of being a non-blind experiment making use of a one-sided test, decreases the robustness of the study.
For my diving, I do take into account the findings of the NEDU study. Given the support – on the basis of a one-sided Fisher’s exact test – for the hypothesis that dive profiles generated by a bubble model are less efficient than those generated by a gas content model, I’m still using a dissolved-gas model, but I am aware of the limitations of this study.
Pending further studies, I do not have evidence that deep stops are more efficient, so overly stressing their importance is not a sensible approach. There are also other reasons for my choice, such as the seemingly higher median VGE grade described in the second section of this study (although, admittedly, a higher VGE grade is not tantamount to DCS) as well as theoretical considerations, but this article is long enough as it is, so I will not go into these topics here. Perhaps a post for another time. In the meantime, despite my current choice, I’m keeping my mind open.
Always remember that no set of gradient factors is universal in its ability to protect one from DCS. Each person’s physiology is different, and each of us can tolerate a different amount of decompression stress. Also, no two dives are exactly the same. The above simply seems to be working fine for me. Whichever dive algorithm you follow, you cannot guarantee you will not get bent. Your computer does not know how fit you are, what your weight and age are, whether you’re well-hydrated, cold, well-rested or stressed out. What you should do is take as many precautions as you can. I like to joke that diving is the sole activity in my life where I wholly embrace conservatism.
I dive because I enjoy this activity. I simply do not understand people who try to get out of the water as quickly as possible towards the end of a dive. Unless you’re freezing cold or otherwise uncomfortable, what could possibly be so annoying about staying a few extra minutes in the water beyond what your computer prescribes? Aren’t those few additional minutes a worthy precaution against landing for a few hours in a hyperbaric chamber? Cutting down on deco time just to be the first one out of the water is nothing to be proud of.
I hope this post will help clear any misunderstandings and misinterpretation (one way or another) of the NEDU data.
Always strive to stay informed, and if you ever hear anyone claiming loudly with an air of certainty the superiority of their approach, be sceptical… VERY sceptical.
Disclaimer:
This post may not be free of error. Any use of this data for dive planning purposes is the sole responsibility of the reader, and can result in serious injury or death. The author assumes no responsibility for the use, be it for diving or any other purpose on the part of the reader, of any of the content presented on this website.
Joseph is an astrophysicist by profession who divides his time between thinking & teaching about space, breathing underwater, and taking pictures of both (and anything in between).
Good job.
Thank you for your balance of detail and summary.